From Dendrograms to Clusters: Unpacking the Benefits of Hierarchical Clustering and K-Means


Table of contents
The realm of AI is characterized by a plethora of techniques used to train models over the past few years. Machine Learning is revolutionizing the way we interact with technology and enabling new levels of automation and intelligence in various industries. From predicting Alzheimer's disease up to six years in advance to analyzing trends in the stock market, machine learning has done it all. It has the power to transform the world. With so many different types of learning techniques such as Supervised and Unsupervised learning, Reinforcement learning, Deep learning and Transfer learning, it can be overwhelming to know about them all at once.
Unsupervised Learning is a type of Machine Learning, where the algorithm tries to identify hidden patterns and structures in your dataset without a labeled output. Whether you're trying to identify new customer segments or detect anomalies in your data, unsupervised learning can help you uncover patterns between different features that you would have never thought were possibly related. So dive in and let your curiosity guide you on my journey of discovery with unsupervised learning.
Today we shall focus on K-means and Hierarchical clustering, one of the most significant clustering techniques in the field of AI.
K-means Clustering

Architecture
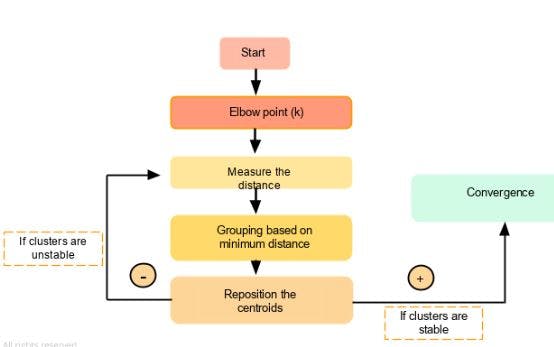
Initialization of n centroids: Before starting our algorithm we should set the number of centroids we are interested in.
Assignment of each data point to its nearest centroids based on the Euclidean distance or other distance metrics. Thereby, creating clusters.
Once the above 2 initial steps are executed, the K-means algorithm recalculates the centroid in each cluster by calculating its mean.
Once we get the new centroids, it forms new clusters based on the nearest data points available.
Steps 3 and 4 are repeated till it either reached the max number of iterations or the centroid no longer changes.
Demonstration of the above steps :
Initially, we can use the elbow method to decide the most optimal number of centroids that can give us the best solution.
#Import all the required libraries
import numpy as np
from sklearn.datasets import make_blobs
from sklearn.cluster import KMeans
import matplotlib.pyplot as plt

#Set random seed to 42, as it make the code reproducible everytime we run it
np.random.seed(42)

#For this example we generate 2 features which follows normal distrubution and concatenate it into a numpy array
X = np.concatenate((np.random.normal(0, 1, (100, 2)), np.random.normal(5, 1, (100, 2))), axis=0)

# Calculate WCSS for a range of cluster sizes. WCSS is the "Within-Cluster Sum of Squares"
WCSS = []
K = range(1,11)
# We run a loop to find the best centroid to use from the range 1-11 and append it to an empty list
for k in K:
    kmeans = KMeans(n_clusters=k)
    kmeans.fit(X)
    WCSS.append(kmeans.inertia_)

# Plot the elbow curve usign the values appended to the list
plt.plot(K, distortions, 'bx-')
plt.xlabel('Number of centroids (k)')
plt.ylabel('WCSS')
plt.title('Elbow method to find optimal k')
plt.show()

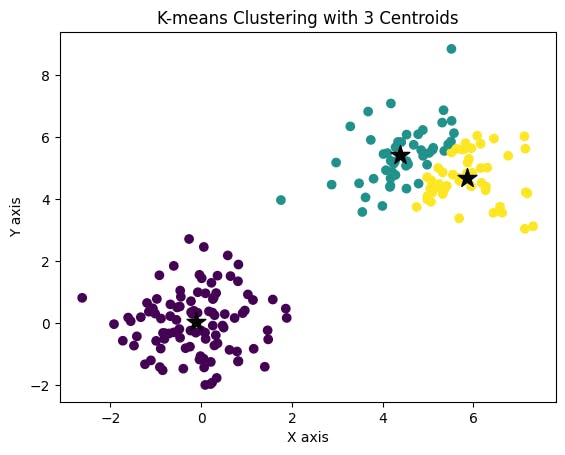
From the above plot, we can see that the elbow is at 3. Hence, we can go ahead and choose the number of centers to be 3.
import matplotlib.pyplot as plt
from sklearn.cluster import KMeans

# Train K-means clustering with 3 centroids
kmeans = KMeans(n_clusters=3, random_state=42)
kmeans.fit(X)

# Plot the resulting clusters
plt.scatter(X[:, 0], X[:, 1], c=kmeans.labels_, cmap='viridis')
plt.scatter(kmeans.cluster_centers_[:, 0], kmeans.cluster_centers_[:, 1], marker='*', s=200, c='#050505')
plt.title('K-means Clustering with 3 Centroids')
plt.xlabel('X axis')
plt.ylabel('Y axis')
plt.show()
The above code will train and fit ur model accordingly and display the features in 3 clusters.
Hierarchical clustering

In this clustering technique, we initially assign each data point as a separate cluster.
Architecture
We calculate the distance between each cluster pair using metrics such as the Euclidean or Manhattan distance
Merge the 2 closest clusters using a linkage method.
Recalculate the distance between the new cluster and the remaining clusters.
Repeat steps 2 and 3 until all the clusters are one single cluster.
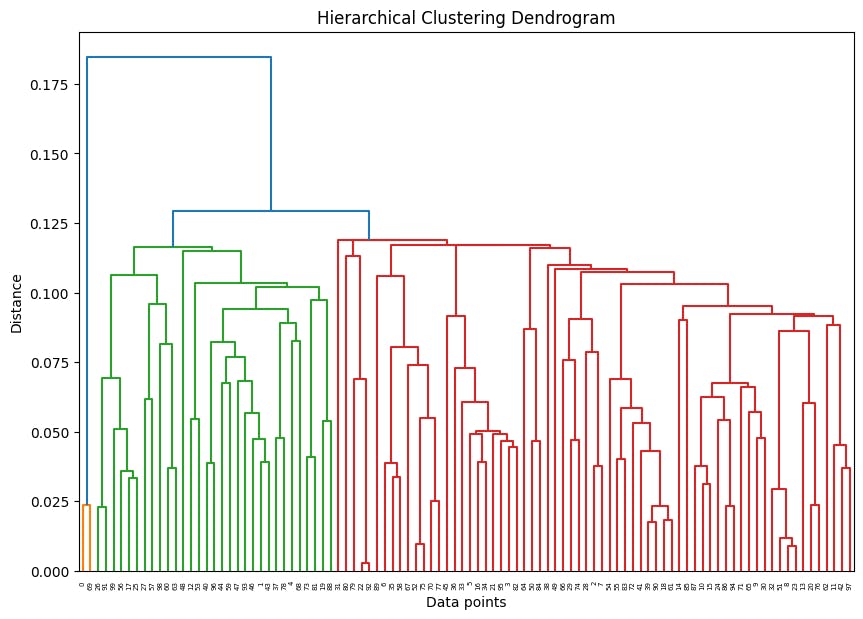
Construct a dendrogram to visualize the hierarchical relationships between clusters and cut it at a specific level to obtain the number of clusters desired.
Once we obtained the number of clusters we can assign all the data points to their respective clusters based on their proximity to the cluster centroid.
Demonstration of the above steps :
#import the neccesary libraries
import numpy as np
import matplotlib.pyplot as plt
from sklearn.cluster import AgglomerativeClustering

# Generate random data points and set the random seed to 42 to make the code reproducible
np.random.seed(42)
X = np.random.rand(100, 2)

# Perform hierarchical clustering without choosing the no of clusters initially
model = AgglomerativeClustering(n_clusters=None, distance_threshold=0)
model.fit(X)
labels = model.labels_

# Plot the dendrogram to visualize the heirarchy diagram of cluster relation
from scipy.cluster.hierarchy import dendrogram, linkage
linked = linkage(X, 'single')
plt.figure(figsize=(10, 7))
dendrogram(linked)
plt.title('Hierarchical Clustering Dendrogram')
plt.xlabel('Data points')
plt.ylabel('Distance')
plt.show()
When to use which technique?
K-means can be used when :
The data points are more separated and spherical.
The number of clusters can be estimated easily.
The dataset is large and high dimensional.
Hierarchical Clustering can be used when :
The dataset is smaller and has low dimensionality.
The structure of the data is not well defined and data is not well separated.
Clusters vary at different levels of granularity, visualization is an important factor.
In general, both techniques have their strengths and weaknesses, Which one to use when depends on the nature of the data and the problem at hand. By understanding the architecture and working of these clustering algorithms, data scientists can apply them to various real-world scenarios.